
Analytics
Analytics gives you traffic and conversion data across your franchise network. The Network Overview shows aggregate performance across all locations; Location Detail drills into a single location; Promotions shows how active campaigns are performing and how widely they’ve been adopted.
When you’d use this
Section titled “When you’d use this”- Monitoring overall network traffic trends and lead volume
- Comparing how individual locations perform against the network
- Seeing which pages get the most views at a location
- Checking how many locations are running a promotion and how many leads it’s driving
The Analytics page
Section titled “The Analytics page”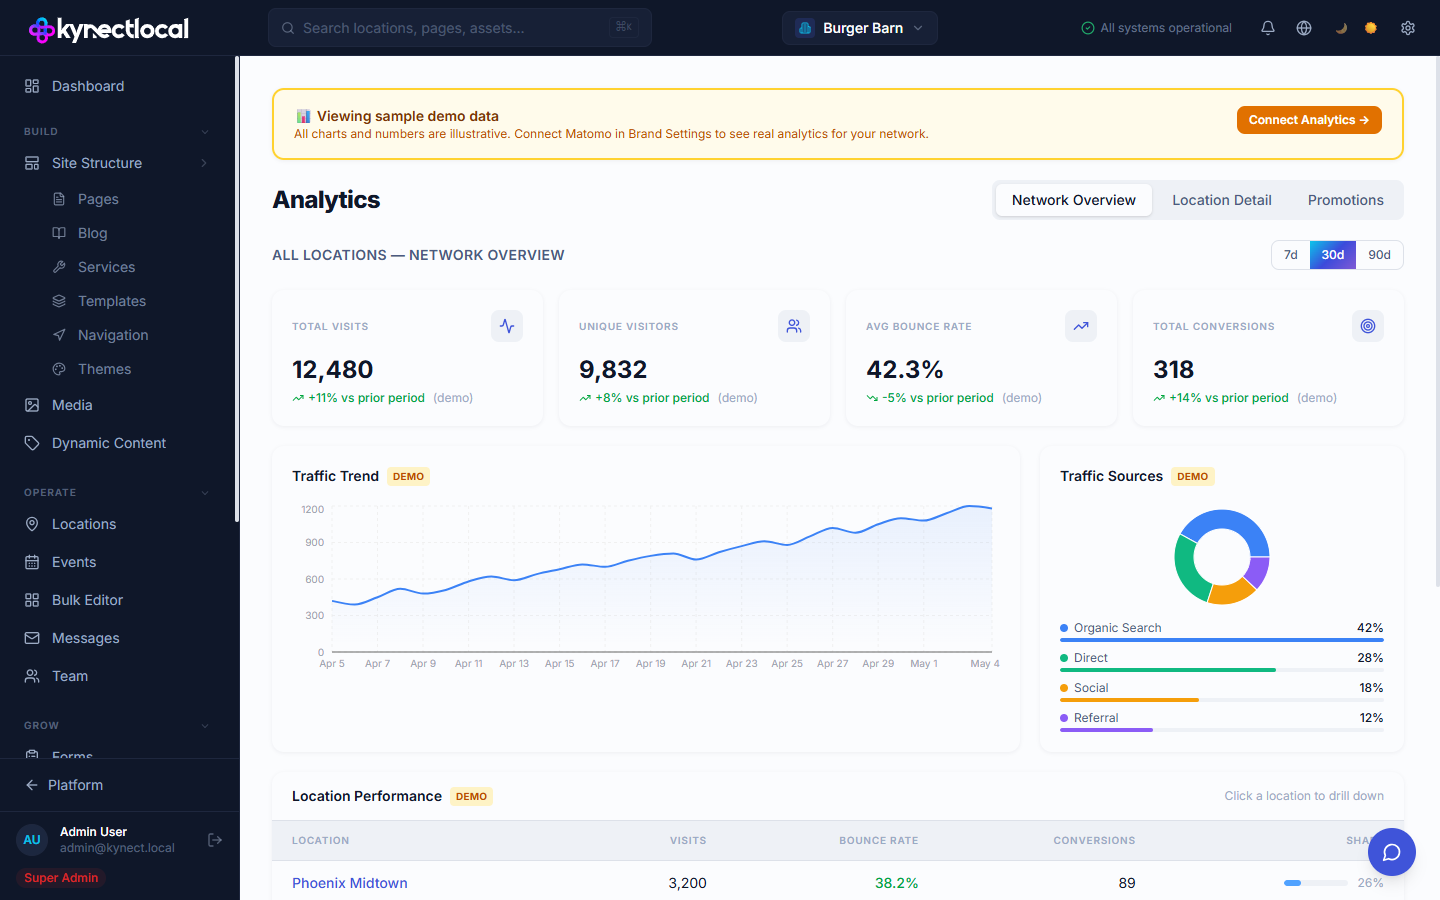
Go to Grow → Analytics. Four tabs organize the data:
| Tab | What it shows |
|---|---|
| Network Overview | Aggregated metrics across all locations |
| Location Detail | Traffic and conversion data for a single location |
| Promotions | Campaign performance and network adoption |
| Mailchimp audience sync status across all location × form combinations |
Use the 7d / 30d / 90d date range selector in the top right to change the time window across all tabs.
Network Overview
Section titled “Network Overview”The Network Overview tab shows aggregate stats across all locations for the selected period:
| Metric | Description |
|---|---|
| Total Visits | Total page visits across all location sites |
| Unique Visitors | Deduplicated visitor count |
| Avg Bounce Rate | Average bounce rate across locations |
| Total Conversions | Total goal completions (form submissions, clicks) |
Each metric shows a percentage change vs. the prior period.
Below the stat cards:
- Traffic Trend — a line chart of daily visits over the selected period
- Traffic Sources — a donut chart breaking down visits by Organic Search, Direct, Social, and Referral
- Location Performance — a table of all locations with their Visits, Bounce Rate, Conversions, and share of network traffic. Click a location row to drill into Location Detail for that location.
Location Detail
Section titled “Location Detail”Select a location from the dropdown to view that location’s stats for the selected period:
- Visits, Unique Visitors, Bounce Rate, Avg Time on Site
- Traffic Trend line chart
- Traffic Sources breakdown
- Top Pages — the pages on this location’s site with the most views, showing Views and Unique Visitors per page
- Goal Conversions — a breakdown of conversion events (e.g. Contact Form Submit, Phone Click) and their counts
Promotions
Section titled “Promotions”The Promotions tab shows performance for active promotion campaigns:
Campaign Performance — a table listing each promotion with:
| Column | Description |
|---|---|
| Promotion | Promotion name |
| Type | Promotion type (e.g. Discount) |
| Status | Active or inactive |
| Locations | Number of locations running this promotion |
| Organic / Promo / Paid | Leads generated by source type |
| Total Leads | Total leads attributed to this promotion |
| Ends | Promotion end date |
Network Adoption — for each promotion, shows what percentage of your location network is currently running it, with a progress bar.
If locations are missing an active promotion, a callout links directly to the Bulk Editor to assign one across multiple locations at once.
Email tab
Section titled “Email tab”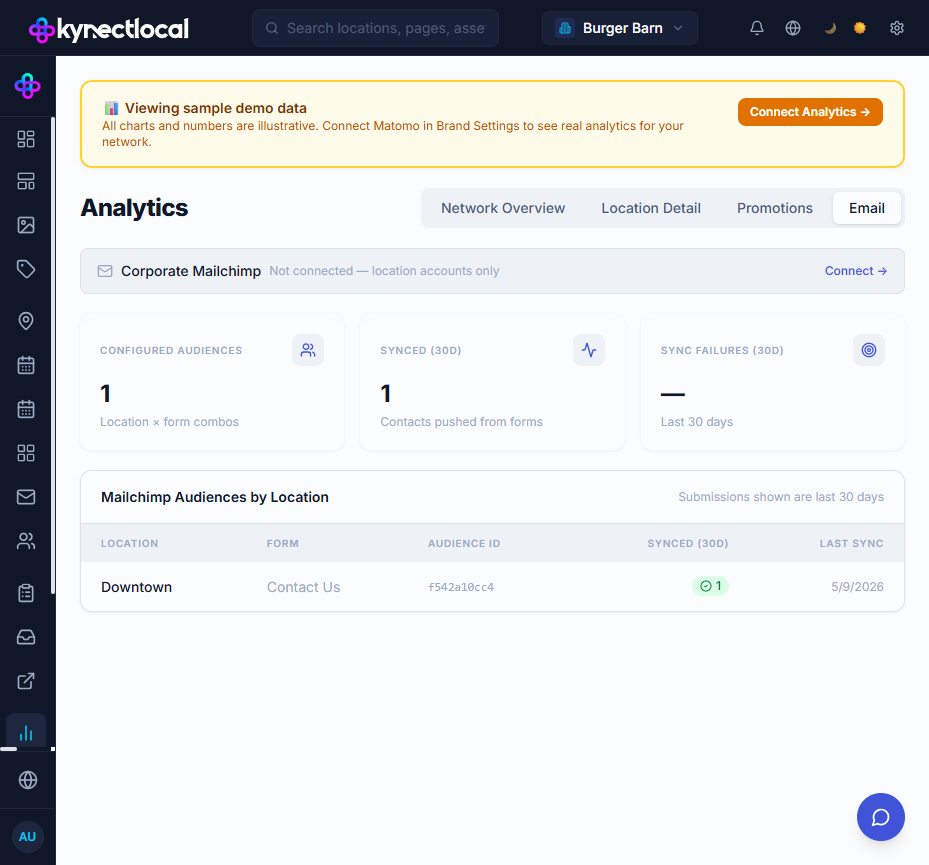
The Email tab gives brand admins a network-wide view of Mailchimp sync activity. It does not require a corporate (brand-level) Mailchimp account — location-level connections set up by franchisees appear in the table regardless.
Corporate Mailchimp banner
Section titled “Corporate Mailchimp banner”A compact status row at the top shows whether the brand-level Mailchimp account is connected:
- Not connected — location accounts only — no brand API key has been saved. Location-level accounts are still tracked in the table below.
- Connected — when a brand API key is set and synced, the banner shows total subscribers and average open rate inline, with a link to the brand Mailchimp detail page.
Click Connect → in the banner to go directly to the Mailchimp integration settings.
Summary KPI cards
Section titled “Summary KPI cards”| Card | What it counts |
|---|---|
| Configured Audiences | Total number of location × form combinations that have a Mailchimp audience assigned |
| Synced (30d) | Total contacts successfully pushed to Mailchimp from forms in the last 30 days |
| Sync Failures (30d) | Failed push attempts in the last 30 days |
Mailchimp Audiences by Location table
Section titled “Mailchimp Audiences by Location table”One row per location × form combination that has an audience configured. Columns:
| Column | Description |
|---|---|
| Location | Location name |
| Form | The form on which a Mailchimp audience is selected |
| Audience ID | The raw Mailchimp list ID (10-character alphanumeric, e.g. f542a10cc4). This matches the Audience ID shown in the Mailchimp dashboard under Audience → Settings |
| Synced (30d) | Contacts pushed from this form in the last 30 days, with a green success count |
| Last Sync | Date of the most recent successful push for this combination |
Corporate Campaigns section
Section titled “Corporate Campaigns section”When the brand-level Mailchimp account is connected and has recent campaign data, a Corporate Campaigns table appears below the main table. It lists recent email campaigns from the brand account with send date, open rate, and click rate.
Related
Section titled “Related”- Mailchimp — connect Mailchimp and configure per-form audiences to populate the Email tab
- Settings — connect Matomo in Brand Settings to enable real analytics data
- Leads — view individual lead submissions alongside traffic data
- Locations — manage location profiles that analytics data maps to
- Bulk Editor — assign promotions to multiple locations at once from the Promotions tab callout