
Digital Impact Report
The Digital Impact Report translates your network’s digital activity — form leads, phone calls, direction requests, reviews, and bookings — into estimated monthly revenue attribution. It gives franchisees and brand admins a concrete dollar figure for what the digital presence is producing.
When you’d use this
Section titled “When you’d use this”- Showing franchisees the revenue value of their digital presence
- Identifying locations that haven’t configured their revenue inputs yet
- Comparing estimated revenue across your location network
The network summary
Section titled “The network summary”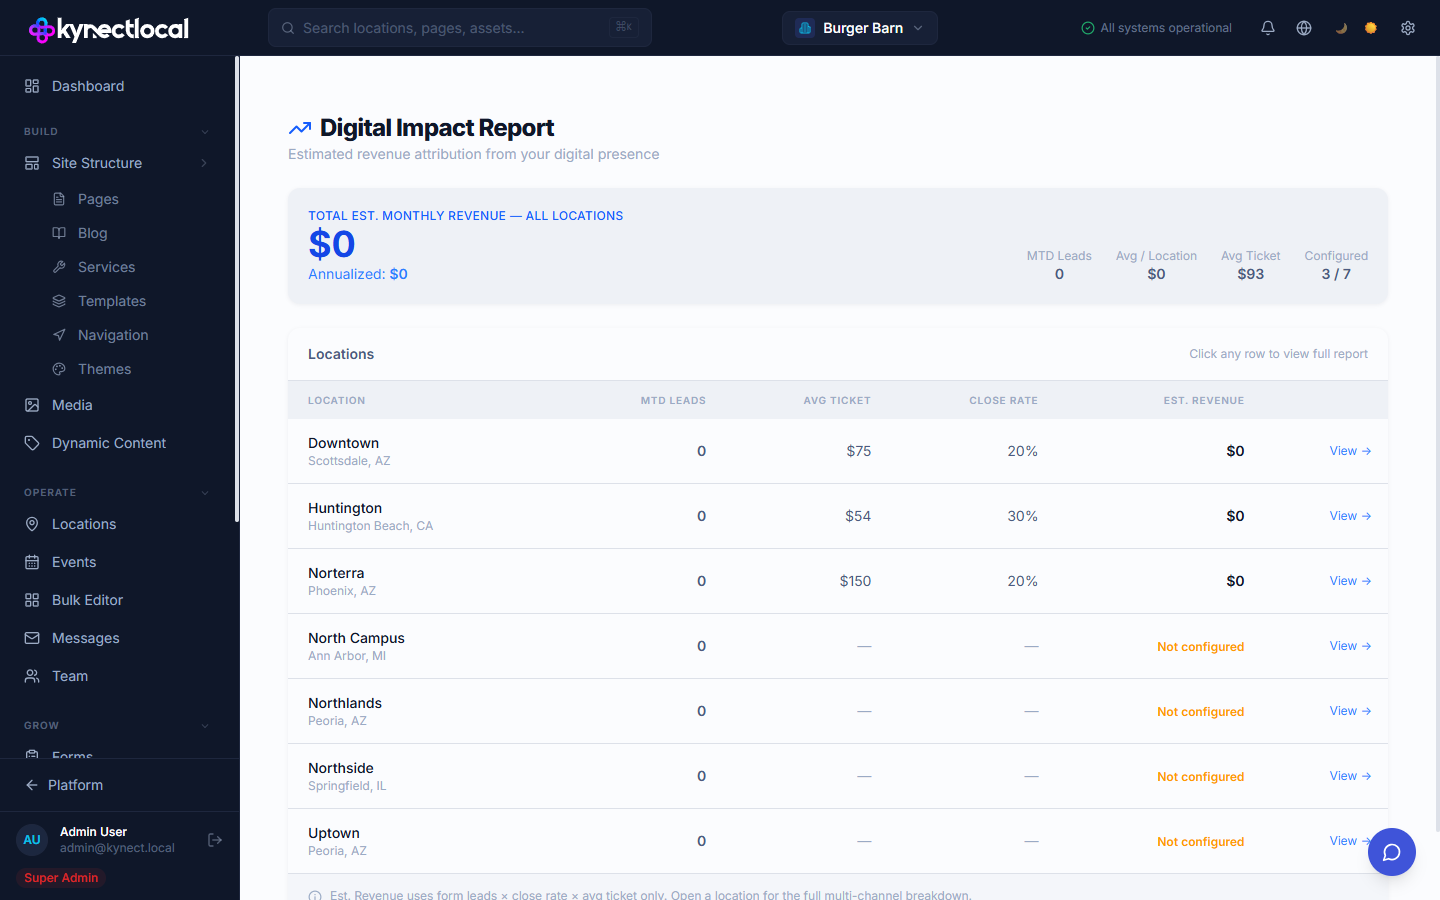
Go to Grow → Digital Impact. The top of the page shows:
- Total Est. Monthly Revenue — aggregate estimated revenue across all configured locations, with an annualized figure
- MTD Leads — month-to-date leads across the network
- Avg / Location — average estimated revenue per location
- Avg Ticket — average ticket size across configured locations
- Configured — how many of your locations have their revenue inputs set up (e.g. “3 / 7”)
The Locations table lists every location with:
| Column | Description |
|---|---|
| Location | Location name and city/state |
| MTD Leads | Month-to-date form leads for this location |
| Avg Ticket | The configured average transaction value |
| Close Rate | The configured lead-to-customer close rate |
| Est. Revenue | Calculated monthly revenue estimate, or “Not configured” if inputs haven’t been set |
Click View → or any row to open the full per-location report.
Per-location report
Section titled “Per-location report”The location report is split into two panels:
Business Inputs
Section titled “Business Inputs”Enter the financial assumptions used in the revenue calculation:
| Field | Description |
|---|---|
| Avg Ticket | Average transaction value in dollars |
| Close Rate | Percentage of leads that convert to customers |
| Baseline Rating | The location’s current Google review star rating |
| Trailing 90-Day Revenue | Optional: actual recent revenue to calibrate the model |
Click Save Inputs to store the values. These inputs are used in all revenue calculations for this location.
Platform Data
Section titled “Platform Data”Live signal data pulled from connected sources:
| Signal | Source |
|---|---|
| Website Form Leads (MTD) | Live — pulled automatically from KynectLocal forms |
| Click-to-Call (MTD) | Connect your call tracking provider |
| Direction Requests (MTD) | Connect Google Business Profile |
| Current Google Rating | Connect Google Business Profile |
| Online Bookings (MTD) | Connect your booking platform |
Click Connect next to any signal to link the data source.
Revenue estimate
Section titled “Revenue estimate”Below the inputs panel, the page shows:
- Estimated Monthly Revenue Attribution — total estimate with an annualized figure
- Broken down into three components: Direct Leads, Foot Traffic, and Review Lift
A footnote on the Revenue Summary reads: Spam leads are excluded from all calculations.
Attribution Breakdown
Section titled “Attribution Breakdown”A table showing how the estimate is calculated for each signal source:
| Column | Description |
|---|---|
| Source | Signal type (Website Forms, Click-to-Call, Direction Requests, etc.) |
| Signal | Raw count for the period |
| Calculation | The formula used (e.g. leads × close rate × avg ticket) |
| Confidence | High, Medium, or Low — based on how directly the signal connects to revenue |
| Est. Revenue | Dollar estimate for this source |
Email Marketing zone
Section titled “Email Marketing zone”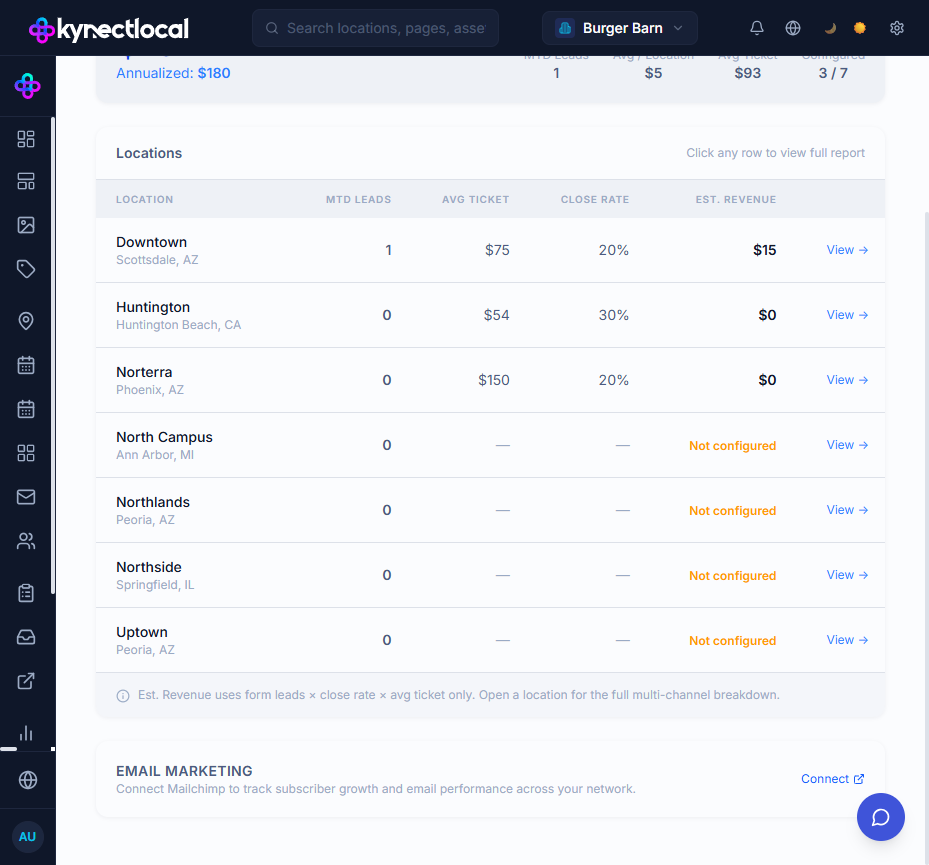
At the bottom of the Digital Impact page, an Email Marketing zone appears when Mailchimp is connected at the brand level or when any location has a Mailchimp API key configured.
When Mailchimp audience data is available, the zone displays:
| Metric | Description |
|---|---|
| Total Subscribers | Aggregate subscriber count across all Mailchimp lists on the connected account |
| Avg Open Rate | Average open rate across recent campaigns |
| Est. Email Revenue | Modeled estimate: subscribers × open rate × 2% conversion × avg ticket |
| Recent Campaigns | A table of recent campaigns, showing send date, open rate, and click rate — only shown when a specific audience ID is configured at the brand or location level |
If no audience ID is set at the brand or location level (because audiences are selected per-form instead), the zone shows aggregate subscriber stats across all lists on the account rather than per-audience metrics.
The Email Re-Engagement row also appears in the Attribution Breakdown table when Mailchimp is connected, showing the modeled revenue contribution from email subscribers.